
The September spam update shook the top 10 for two weeks, but once it closed it kept about what a normal fortnight takes
October 16, 2026
In this logbook 6 instalments
- Oct 16, 2026 · Latest The September spam update shook the top 10 for two weeks, but once it closed it kept about what a normal fortnight takes
- Sep 25, 2026 On day one of the Spam Update we lost twice the usual share of top 10 rankings, and it still cannot be pinned on the Update
- Aug 28, 2026 We measured the August spam update across 946 of our own keywords: 7 out of 8 projects had a normal week
- Aug 25, 2026 The August spam update is over, and there is still not a single public data point on impact
- Aug 19, 2026 Google ships the year's third spam update and impossible figures are already circulating
- Jun 4, 2026 The May 2026 core update rewards creators and sinks aggregators

On 8 October Google closed the spam update it had launched on 24 September. Two weeks of rollout, by far the longest of the year, and during those two weeks my portfolio moved almost four times more than normal: there were days when one in four keywords in the top 10 vanished from one day to the next.
Three weeks later, this is the balance:
- During the rollout it looked like a disaster. An average of 6.8% of the top 10 lost each day, against 1.8% on a normal day.
- Once it closed, it was not. Of 391 keywords that were in the top 10 on 24 September, 14 are still out three weeks later. In any ordinary fortnight, with no update, 11 are lost. Three keywords of difference in a portfolio of almost 400.
- What did change was what comes in. In a normal fortnight, 13 keywords climb into the top 10 and stay. During the update, 6. The portfolio did not sink: it stopped growing.
I give the full detail because on 25 September I wrote down at this URL how I would measure it, before seeing the result. It is time for what I promised: the result, whatever it is.
According to Google's status dashboard, the rollout started on 24 September at 9:15 and ended on 8 October at 1:00 (Pacific time, 10:00 in mainland Spain): 13 days and almost 16 hours. That fits within the two weeks it announced and is five times longer than any other spam update this year. Yesterday the one-week margin I set myself ran out, so the data is in.
What Google said when it closed
One line: that the rollout was complete on 8 October. Nothing on the share of queries it touched or on which policies it targeted. Barry Schwartz, at Search Engine Roundtable, describes it as a fairly impactful update that some are already comparing to a core update, and places the days with most movement on 25 to 27 September, the 30th, and 4 to 6 October. That is a reading of third-party volatility tools, not data from Google.
What happened in my portfolio during the rollout
Those dates partly overlap with mine. With daily positions for 18 projects and 608 keywords on Google Spain (fewer than on 25 September, because some projects are no longer tracked; the detail is in the methodology), on a normal day 1.8% of the keywords in the top 10 drop out of it. During the rollout the average was 6.8% a day, 3.7 times the norm.
| Period | Drop out of the top 10 per day (%) | Drop out of the top 100 per day (keywords) |
|---|---|---|
| 7 August to 17 September (normal) | 1.8% | 3.5 |
| 18 to 24 September (before the announcement) | 2.5% | 4.7 |
| 25 September to 8 October (rollout) | 6.8% | 18.4 |
| 9 to 15 October (after it closed) | 1.7% | 15.6 |
The peak came on 3 and 4 October. On those two days between one in five and one in four keywords in the top 10 dropped out of it (21% and 25%), in 15 of the 18 projects. And on 5 October 110 keywords came back into the top 100 at once. It is the 18 September pattern I described here, on a larger scale: a shake that undoes itself within 24 or 48 hours.
The result with the method I set before seeing it
On 25 September I wrote down how I would measure it, so I could not move the goalposts once I saw the data. I apply it as written:
- Update window: keywords in the top 10 on 24 September, before the announcement. A loss is one that is out of the top 10 when the rollout closed (8 October) and still out seven days later (15 October).
- Control window: same length and same rule, 27 August to 17 September. It starts after the August spam update had finished and ends before the instability of 18 September.
- Same portfolio: the same 608 keywords in both windows, with the same tool. Two of the 18 projects are the agency's own websites.
| Metric | Control (27 Aug - 17 Sep) | Update (24 Sep - 15 Oct) |
|---|---|---|
| Keywords in the top 10 at the start | 377 | 391 |
| Still out of the top 10 after 21 days | 11 (2.9%) | 14 (3.6%) |
| Of those, out of the top 100 as well | 1 | 4 |
| Enter the top 10 and stay | 13 | 6 |
| Net change in top 10 keywords | +2 | −8 |
3.6% against 2.9%: three more keywords lost in a portfolio of almost 400. At the control window's rate, the chance of seeing 14 or more losses by pure luck is 26%. That is not enough to pin them on the update. Against the 23 windows of 21 days that fit between 6 August and 18 September, the update window comes out above all of them (the worst lost 3.2% and the median 2.6%), but by between one and four keywords.
Nor do the 14 losses look like a penalty. Nine have stayed on page two, between positions 11 and 20, one has fallen to 50 and only four have left the top 100. The median position of the 391 keywords that were in the top 10 was 2 on 24 September and is still 2 on 15 October; 299 are at the same position or better.
During the rollout the portfolio did not sink: it stopped growing
Where something does show is in what comes in, and it is the row of the table people look at least. In the control window, 13 keywords climbed into the top 10 and stayed. In the update window, 6, less than half.
The breakdown by sector: none breaks away from its control
I promised it broken down by sector, so here it is:
| Sector | Projects | Losses in the update | Losses in the control |
|---|---|---|---|
| Automotive | 2 | 2 of 225 | 2 of 219 |
| Immigration | 1 | 5 of 41 | 6 of 42 |
| Finance | 1 | 1 of 25 | 2 of 26 |
| Consulting | 1 | 2 of 25 | 0 of 24 |
| Legal | 3 | 1 of 21 | 0 of 20 |
| Marketing | 2 | 1 of 19 | 0 of 16 |
| Travel | 2 | 1 of 14 | 0 of 13 |
| Repair services | 1 | 1 of 4 | 0 of 3 |
| Home, health, energy, logistics and ecommerce | 5 | 0 of 17 | 1 of 14 |
| Total | 18 | 14 of 391 | 11 of 377 |
On 25 September I noted that the first day's losses were spread across 8 sectors, and that if the pattern held this update would be broader than August's. At the close they are still spread across 8 sectors, but none loses more than two keywords beyond what it lost in the control window. Immigration, which accounts for 5 of the 14, lost 6 in a normal fortnight: it is a project that always moves. And automotive, which supplies more than half of the measured top 10, loses exactly the same in both windows.
What is left after the close
The top 10 has calmed down: from 9 to 15 October 1.7% drop out a day, the same as before the update. What has not calmed down is the background. Around 16 keywords a day are still leaving the top 100 and as many coming back, more than four times the norm. On 12 October 58 left and on the 15th 74 came back. If this week you see one of your keywords outside the top 100, it is more likely a flicker than a loss.
What I would do now
With that background still moving, the order matters. First, measure your drop against your own baseline, not against the headline. Check what share of your top 10 is still out three weeks later in a normal fortnight; if what you have lost since 24 September is within that range, it is not the update. Second, if it is clearly above and concentrated on one page type, that is when to audit against the spam policies (scaled content, site reputation abuse, expired domains, links), knowing that Google talks about months to recover. And third, do not delete or rewrite in bulk because of a snapshot from 4 October: that day the whole portfolio looked penalised and the next day it no longer did.
And keep the measurement ready. Barry Schwartz does not rule out a core update soon, and at this year's pace the next move will not wait for the windows to be clean.
My conclusion: what you see during an update is not what is left afterwards
For two weeks the volatility tools said this update had a lot of impact, and in my portfolio it moved 3.7 times more than normal. Had I measured it on 4 October, I would have written off a quarter of the top 10 and called five clients to tell them. Three weeks later, what is left is three more keywords lost than in any ordinary fortnight and half the new entries.
That is the lesson, and it is not only about this update: movement during a rollout and the effect of the update are two different things, and the first does not predict the second. An algorithm recalculating live shakes positions; that does not mean it will leave them shaken.
To know which of the two you are looking at you only need two things, and neither is expensive. One, wait: until the official close, plus a week. Two, have your own baseline, that is, know how much your site loses in a fortnight when nothing happens. Without it, any drop looks like a penalty. With it, today I know that mine lost three keywords more than usual, and that this is not a penalty: it is just another Tuesday.
Methodology
- Source and market: SE Ranking, Google Spain, national results without a fixed location, daily checks from 6 August to 15 October 2026.
- Sample: 18 projects and 608 keywords with data on the six dates the two windows compare. Two of the 18 projects are the agency's own websites.
- Exclusions: tracking with a fixed location, an ecommerce project with anomalous position flicker since 18 September, a project with no data on the closing date, and days on which the tool returned no position at all for a project.
- Change of sample: it is smaller than on 25 September (24 projects) because some projects are no longer tracked or lack complete data on those dates, which is why this instalment's daily figures do not match that one's.
- Definition of a loss: keyword in the top 10 on the window's first day, out of the top 10 after 14 days and also after 21.
- Statistical test: the update window is compared with the control window using a one-tailed binomial test.
- Transparency: we include no identifiable client data; projects are grouped by sector.
#seo#core-update#eeat
Previous updates
On day one of the Spam Update we lost twice the usual share of top 10 rankings, and it still cannot be pinned on the Update
Google launched the September 2026 spam update yesterday, 24 September at 9:15 Pacific time (18:15 in mainland Spain). It applies globally and to all languages, and the notice carries a line no spam update this year had carried: the rollout may take up to two weeks. It is the fourth spam update of 2026 and it lands 37 days after the August one, which I analysed on this same URL.
What is different from the previous spam updates
What changes is the duration. This year's three previous ones were announced for "a few days" and closed in under three. This one comes with the timeframe Google usually keeps for core updates, and it is not a typo: John Mueller confirmed on Bluesky that it is likely to take longer than the previous ones.
| Spam update | Start | Actual duration | Days since the previous one |
|---|---|---|---|
| March 2026 | 24 March | 19 h 30 min | 210 (since August 2025) |
| June 2026 | 24 June | 2 days 1 h | 92 |
| August 2026 | 18 August | 2 days 16 h | 55 |
| September 2026 | 24 September | Ongoing, up to 2 weeks | 37 |
The only recent spam update with a comparable rollout was August 2025, which took 26 days and 15 hours. It was also the only one in the whole of 2025. So far in 2026 there have been four, and the gap between them keeps shrinking: 92 days, 55 and now 37.
The figure I care most about is the cadence
Because that right-hand column says more than the duration one. One spam update a year was an event. Four in six months, closer together each time and now with two-week rollouts, starts to look like a continuous process. That has a practical consequence almost nobody is looking at: clean measurement windows are running out.
If this one takes two weeks to roll out and you need at least another week for the noise to settle, a reliable reading will not arrive before mid-October. At the current pace, the next one could be walking in by then. I do not take it for granted, but it is the scenario worth having your measurement ready for.
What exactly Google has said, and what it has not
On the content of the update, the same as in August: a name, global scope, all languages and a timeframe. It has not said which policies it targets, what share of queries it touches, or whether any rule has changed. Search Engine Roundtable reads it as an update that does not go after link spam, but that is the outlet's reading, not a statement from Google.
What Google's documentation does say, and it is worth keeping in mind before touching anything: recovery after fixing a spam problem is measured in months, and whatever benefit a site got from spam links does not come back once it has been neutralised.
What my portfolio already shows
With that on the table, on to what I can measure myself. In August I measured with weekly checks. This time I have something better: daily positions for 24 projects and 698 keywords on Google Spain, since 6 August. Fifty consecutive days, which means I know what a normal day looks like before looking at the update day.
The metric is the same as in August, the only one that moved back then: how many keywords that were in the top 10 lose it from one day to the next. The announcement came at 18:15 on the 24th, so the first complete check after it is the one on the 25th.
| Day | What was going on | Lose the top 10 |
|---|---|---|
| A normal day | Median from 7 August to 24 September | 1.9% |
| 18 September | Nothing confirmed | 9.8% (41 of 419) |
| 23 September | Volatility reported in the US | 2.3% (10 of 430) |
| 25 September | First day of the spam update | 4.2% (18 of 430) |
On the 25th we lost 4.2% of the keywords that were in the top 10, twice a normal day. It is not statistical chance: against the rate of the previous 49 days, the probability of seeing 18 losses or more by pure luck is below 1%. It is the third worst day out of fifty, tied with 17 September.
And there is a difference from August that I think matters. Back then a single sector accounted for the entire effect. Today the 18 losses are spread across 10 projects in 8 sectors: legal, immigration, finance, automotive, travel, ecommerce, lotteries and marketing. If the pattern holds, this update is broader than the last one.
Why I am not blaming the update yet
Because when I open up those 18 losses, 13 are sudden drops: keywords that were in the top 10 and the next day are not even in the top 100. Over the previous fifty days I logged 97 drops like that, and 84.5% came back to the top 100 within 48 hours (63% the next day). A spam penalty does not behave like that. A flickering SERP does.
The best example is 18 September, a day with nothing confirmed. This is how an automotive project behaved with the 29 keywords that lost the top 10 that day:
| Date | Keywords in the top 10 | Average position | Out of the top 100 |
|---|---|---|---|
| 17 September | 29 | 2.2 | 0 |
| 18 September | 0 | — | 17 |
| 22 September | 29 | 2.0 | 0 |
Had I read that day the way the 25th is being read today, I would have declared a project penalised when it was not.
There is also a background of instability that predates the announcement.
| Period | Leave the top 100 per day | Come back to the top 100 per day |
|---|---|---|
| Until 17 September | ~4 | ~4 |
| Since 18 September | ~28 | ~28 |
That is seven times more movement in both directions. On the other hand, the 23rd, the day US tools flagged volatility and an update was taken for granted, was the calmest of the fifty days in my portfolio.
How I will measure it this time
In August I learned that a rollout week is no basis for judging an update. So I am writing the method down today, before seeing the result, so I cannot move the goalposts when I see it:
- When: once Google marks the rollout as complete on its status dashboard, plus one week. Not before.
- What counts as a loss: a keyword that leaves the top 10 and is still out 7 days later. Drops that come back within 48 hours do not count.
- Against what: a control window of the same length, before 24 September, with the same portfolio and the same tool.
- What I will publish: the result, whatever it is, broken down by sector.
What I would do this week
While that clock runs, there are three things that do make sense. If you have lost positions since yesterday, first check whether they hold: repeat the measurement at 48 and 72 hours before counting it as a drop. Second, do not touch anything that could later be mistaken for the effect of the update. Third, look at the manual actions report in Search Console: a spam update is algorithmic and sends no notice, so if there is something there, the problem is a different one.
If the drop holds once the rollout is over, the advice I keep repeating on this URL does not change: audit against the current spam policies (scaled content, site reputation abuse, expired domains, links) before blaming the calendar.
My takeaway: without a baseline, day one only measures noise
Google is turning spam updates into something almost continuous and says less about each one. The only defence against that is your own baseline: knowing how much your portfolio moves on a normal day. Without it, the first day of an update teaches you more about noise than about the update. With it, today I know the 25th was an unusual day, and also that the 18th was worse.
Methodology: SE Ranking, Google Spain, national results with no fixed location, daily checks from 6 August to 25 September 2026. 24 projects and 698 keywords. Excluded: location-pinned tracking, one ecommerce project with anomalous position flickering since 18 September, and days when the tool returned no position at all for a project. Top 10 loss: a keyword in the top 10 one day and out the next. 25 September is compared with the pooled rate of the previous 49 days using a one-tailed binomial test. We include no identifiable client data: projects are grouped by sector.
We measured the August spam update across 946 of our own keywords: 7 out of 8 projects had a normal week
On 25 August I wrote here that I would not publish conclusions about this update until I had data, and that the date was today. Here it is. It does not say what I expected.
The industry finally has its first analysis with a sample
Yesterday, 27 August, the first one worthy of the name came out. SE Ranking measured 100,000 keywords across 20 industries in the US market and found that 16.71% of the URLs sitting in the top 10 fell beyond position 100 between 17 and 22 August, against 9.2% in a July window with no confirmed update. An 82% increase in disappearances. It is exactly the data point that had been missing since the 18th.
Google's status dashboard, meanwhile, still shows nothing new after 18 August, even though unconfirmed volatility spikes are being reported around the 26th.
How I measured the update across my own portfolio
Before reading anyone else's analysis, I measured mine. Eight projects with weekly rank tracking, 1,357 tracked keywords and eight different sectors, Spanish market, desktop results.
All eight are checked on the same day of the week, and that gives me something you cannot buy: two seven-day windows that are exactly comparable. The update window, 14 to 21 August, which contains the entire rollout. And a control window, 7 to 14 August, the previous week with no confirmed update. Same sample, same tracker, same weekday. The only thing that changes between them is that one had an update in it.
| Metric | Control (7-14 Aug) | Update (14-21 Aug) | Real difference? |
|---|---|---|---|
| Keywords that move | 64.1% | 61.8% | No |
| Median movement | 1 position | 1 position | No |
| Drop out of the tracked range | 6.5% | 6.7% | No |
| Lose the top 10 | 5.6% | 10.8% | Yes |
What did not change
The general churn was the same: 61.8% of keywords moved during the update and 64.1% during the control week. Median movement was one position in both windows.
And disappearances, keywords that drop out of the range I track, came in at 6.7% against 6.5%. That difference means nothing.
That is the figure that surprised me most, because it runs straight against the day's headline. My metric is stricter than SE Ranking's: they measure falls beyond position 100 and I track down to 30, so a fall from position 5 to 60 counts as a disappearance for me and not for them. Measured with the more sensitive of the two yardsticks, it did not move.
What did change
One single thing: losing the top 10 doubled. 10.8% of the keywords sitting in the top 10 lost it during the update, against 5.6% the week before. With 640 and 627 keywords as the base, that difference holds up.
It is a different phenomenon from the one in the headline. There were no collapses in my portfolio: there were first-page losses with the keyword still visible.
And now the uncomfortable part: it is not the market, it is one sector
That 10.8% is not spread out. Broken down by project, one alone, the events one, went from 9.3% to 33.7% in top 10 losses. The rest did not:
- Legal: 4.3%, with 186 keywords in the top 10.
- Automotive: 4.1%, with 97.
- B2B logistics: 9.1%, with 44.
- Pharmacy: 6.2%, and it lost fewer top 10 spots during the update than the week before, when it was 13.3%.
If I take the events project out of the sample, the aggregate difference disappears: 7.4% against 5.1%, inside the noise. The effect I see across my portfolio is not general. It is one sector.
What I take from this
That "the update hit hard" and "nothing happened to your site" can both be true at once, and usually are. A sample of 100,000 keywords tells you how the aggregate behaved; it does not tell you whether your Tuesday drop is this update.
With seven of my eight projects indistinguishable from any ordinary week, the recommendation I gave on 25 August does not change: when you drop, audit against the current spam policies before assuming the update is to blame. It is still far more likely that the cause is on the site than on the calendar.
We are reviewing the events project now, and there the question is not whether it was the update. It is what those URLs had that made them vulnerable to stricter enforcement of rules that have not changed. When I know, I will write it here.
Methodology: Ahrefs Rank Tracker across 8 projects in 8 sectors, 1,357 tracked keywords, Spanish market, desktop results. 946 keywords held a position inside the tracked range in the update window and 950 in the control window. Weekly checks on the same weekday in both windows: 14 and 21 August 2026 for the update, 7 and 14 for the control. Differences assessed with a two-tailed test of proportions. We do not include identifiable client data: projects are grouped by sector.
The August spam update is over, and there is still not a single public data point on impact
Google declared the August 2026 spam update closed on 21 August at 01:49 Pacific time. It began on the 18th, so the rollout lasted 2 days and 16 hours: the longest of the three spam updates released this year. A few days ago I pointed out it was too early to assess who it was hitting and, four days after the close, that has not changed.
What Google has confirmed (and the 4 profiles in the crosshairs)
Google has provided no further detail since the close: no post on the official blog, no new policies, no extra guidance. The status dashboard update simply confirms the rollout is finished. The same premise applies as on day one: these are the spam policies already published, enforced more harshly.
What can be stated with certainty, based on Google's official rules rather than speculation, is which profiles have long been in the crosshairs:
- Mass-produced content: automated or bulk generation of low quality.
- Doorway pages: URLs created solely to funnel users to other destinations.
- Expired domains: purchases of old domains aimed at exploiting their prior authority.
- AI content to win citations: a practice tied directly to June's spam update, where Google equated mentions bought in AI summaries with paid links.
Impact analysis: why it pays to wait until 28 August
Four days after the close, there is still not a single rigorous analysis with data isolating this update's real impact. What circulates today amounts to lists of "sites at risk" that merely restate the spam rules that already existed before 18 August.
The criterion stands: a first reliable reading requires letting a week pass after the close, which puts the analysis on 28 August. Publishing conclusions ahead of time would just replicate the rushed volatility of the 24-hour reports.
Recommended steps while the data settles
If you suspect a negative impact, the useful work is not tracking volatility charts but auditing against the spam guidelines in force:
- If you spot questionable practices: the cause will be right there, with no need to wait for external reports.
- If the site complies with the policies: it is worth checking whether the drop responds to this update or to another factor that coincided in time.
Remember: Google tends to insist that recovery times after a spam action are always measured in months.
Google ships the year's third spam update and impossible figures are already circulating
Google confirmed yesterday, 18 August at 9:27 Pacific time, the release of the August 2026 spam update. It applies globally and to all languages, and the notice itself says the rollout may take several days to complete. It is the third spam update Google has announced this year. I have spent since yesterday reading analyses of who it is hitting, and that is precisely the problem.
What exactly has Google said, and what has it not?
What is confirmed fits in three lines: the name, the global scope, and that it will take days. Nothing else. Google has announced no new spam policy, so the rules that apply are the ones already published, enforced through SpamBrain. It has not said which techniques it targets, which sectors it touches, or which signals carry weight.
And it is worth remembering something Google has always said about this kind of action: recovery, when it comes, is measured in months, not weeks.
How does it differ from the June spam update?
This one matters because I analyzed it here two months ago. The June 2026 spam update arrived with a stated target: it went after link spam, and Gary Illyes took the chance to confirm at Search Central Live Shanghai that buying mentions to surface in AI Overviews is spam, putting them on a par with paid links.
August's arrives with no stated target. That is a practical difference: in June you knew where to start looking the same day it was announced. Now you do not, and anyone telling you otherwise is making it up.
Why can nobody say yet who it affects?
Within 24 hours of the announcement I have already seen a specific figure circulating: that sites with good Core Web Vitals are gaining between 12% and 28% more traffic. That number is impossible. The rollout has not finished, Google warns it takes days, and nobody can isolate the effect of an ongoing update with one day of data and present it to two decimal places.
This is exactly the pattern I criticized in the Reddit guide: figures that sound authoritative and do not hold up once you check when they were measured.
What do I look at, and when?
The criterion I use is the same one I applied to the May 2026 core update: you analyze nothing until the rollout is done. With that one, the clean analysis window did not open until a week after it closed. With this one, which started on the 18th and will take days, that puts the first reliable reading at the end of August.
In the meantime, all I do is get the measurement ready: mark the start date on the projects, touch nothing that could later be mistaken for an effect of the update, and resist the temptation to explain every rise and fall of these days, which is rollout noise.
My take
A spam update with no new policy means Google has not changed the rules: it has raised the bar on enforcing the ones that already existed. If it hit you, the question is not what changed in the algorithm, but what you have been doing that already broke the rules before yesterday.
And if it did not hit you, the useful reading is not to celebrate, it is to wait: with a rollout of several days, it still can.
The May 2026 core update rewards creators and sinks aggregators
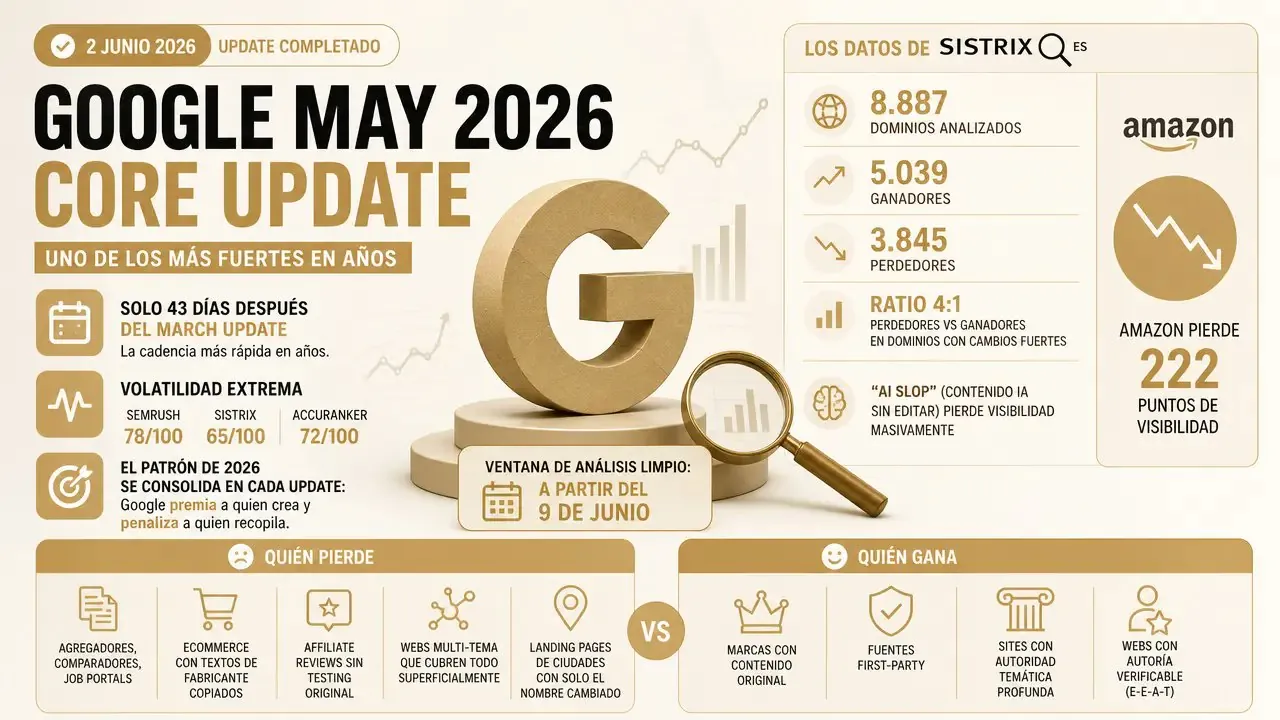
On 2 June Google declared the May 2026 core update done and, honestly, I had not seen a jolt like this in years. I felt it before reading any report: rankings shifting day to day on projects that had been flat for months. Then the numbers landed and confirmed the feeling, with volatility of 78/100 on Semrush, 65/100 on SISTRIX and 72/100 on Accuranker. One of the strongest updates in years.
What surprised me most was the cadence. This update arrived just 43 days after the March update, the fastest pace I can remember. Google no longer waits months between waves, so the idea of "I will wait for the next core to recover" falls short: by the time you react, you are already inside the next one.
I sat down with the SISTRIX data and the split is sharp. Of 8,887 domains analyzed, 5,039 gained and 3,845 lost, but among those that moved hard the ratio was 4 losers for every winner. Amazon shed 222 visibility points. And one pattern shouted above the rest: "AI slop", AI-generated content published without editing, collapsed across the board.
When I look at who fell, the profile repeats project after project: aggregators, comparators and job portals; ecommerce with manufacturer descriptions copied verbatim; affiliate reviews without a single real test of the product; multi-topic sites that touch everything in passing; and city landing pages cloned by swapping only the name. Recycling stopped working.
And who rose is just as clear: brands with their own content, first-party sources, sites with deep topical authority and verifiable authorship (real E-E-A-T, not a decorative author box). The 2026 pattern consolidates with every update, Google rewards those who create and penalizes those who aggregate. A practical note: the clean analysis window opens on 9 June, before that the data is too noisy to decide anything.
We help you scale your business.
Contact us