Table of contents
Dashboard
A dashboard is a graphical representation of the information created to help monitor and manage a business, company, project, etc. A dashboard should show the key performance indicators (KPIs) that are the most important metrics to analyze and assess your business, it is the way to measure marketing and/or business objectives in order to make decisions.
A good scorecard should be easy to read at a glance, the main purpose of any scorecard is a graphical representation of the balance between the proportion of data to be displayed and the accurate picture of the company’s performance
What is a dashboard?
Un dashboard es una representación gráfica de la información creada para ayudar a supervisar y gestionar un negocio, empresa, proyecto, etc. Un cuadro de mando debe mostrar los indicadores clave de rendimiento (KPI) que son las métricas para analizar más importantes del negocio, es la manera de medir los objetivos de marketing y/o negocio para poder tomar decisiones.
Un buen cuadro de mando debe ser fácil de leer en un golpe de vista, el propósito principal de todo cuadro de mando es una representación gráfica del balance entre la proporción de datos a mostrar y la imagen precisa del rendimiento de la empresa.

Benefits of a good dashboard
The dashboard is a simple and accessible way to get the most out of analytics and data. It’s a quick overview of what’s happening right now, so you can make informed decisions about how to optimize your marketing and/or business strategy.
It is a fundamental analysis tool to keep the project objectives aligned with the rest of the team.
Creating a good dashboard will allow you to see how the resources used in the strategy are performing; the dashboard makes it easy to see which areas of your marketing are working well and which need improvement.
A dashboard is a very useful tool for businesses, whether you are a small or large company. We have deciphered the seven reasons why you should implement a dashboard in your projects:
- Saving time. The creation of dashboards is an important investment of resources in time and money. Creating new tools for presenting and updating data, as well as reports, involves maintenance and updates, which, if done automatically, is an effective way to invest time in analysis and implementation of improvements, rather than data collection.
- Make better decisions. In a simple way and at a glance, a dashboard will allow you to make decisions that you might not otherwise be able to see or analyze.
- Tracking. Track performance over time allowing you to see progress and find problems faster.
- Insight. Gain deep knowledge of what is happening across the whole enterprise or project, so that you can understand how actions are working, or not, as a whole.
- Alignment. Dashboards help teams work better together by sharing data with each other and giving insight into the situation of the company and the different departments and/or marketing channels.
- Communication. Dashboards help communicate to your clients how business and/or marketing performance is going; for example, if there has been a problem with a type of content or section, it is easy to set up the dashboard to show your clients where the section is and what caused it.
- Customer loyalty. A quick response to a customer request is part of the support service and customer loyalty. Being able to use a dashboard to know what is happening in response to a customer’s request is an effective way to save time, service and customer loyalty.

Types of dashboards
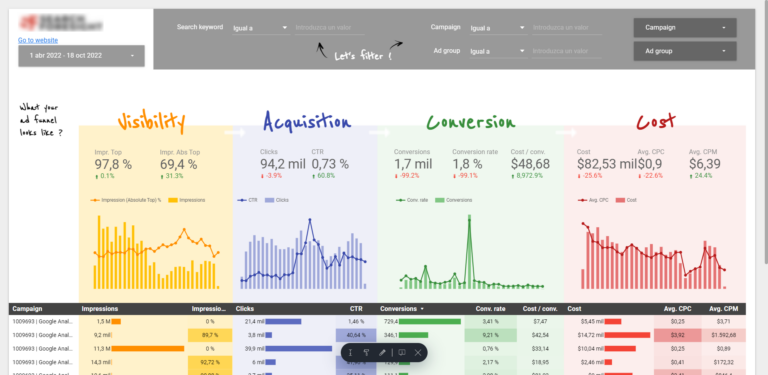
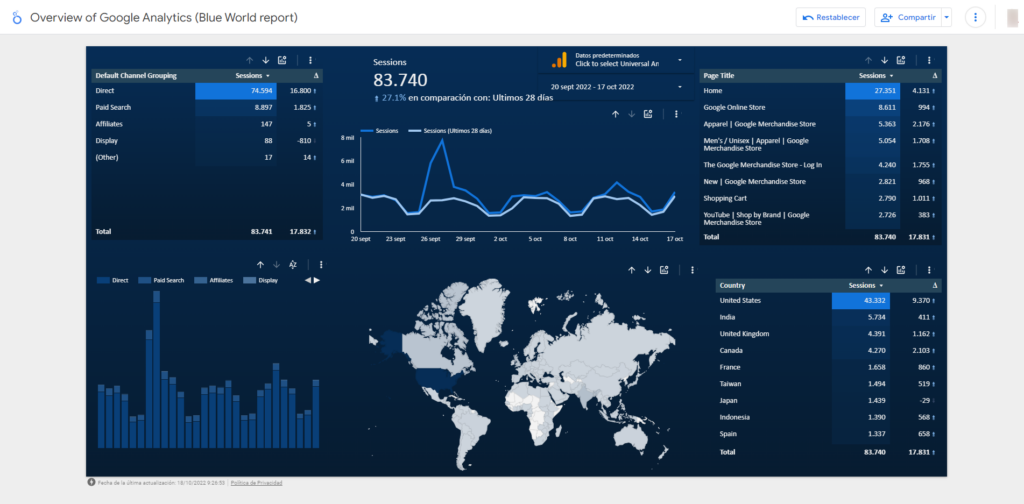
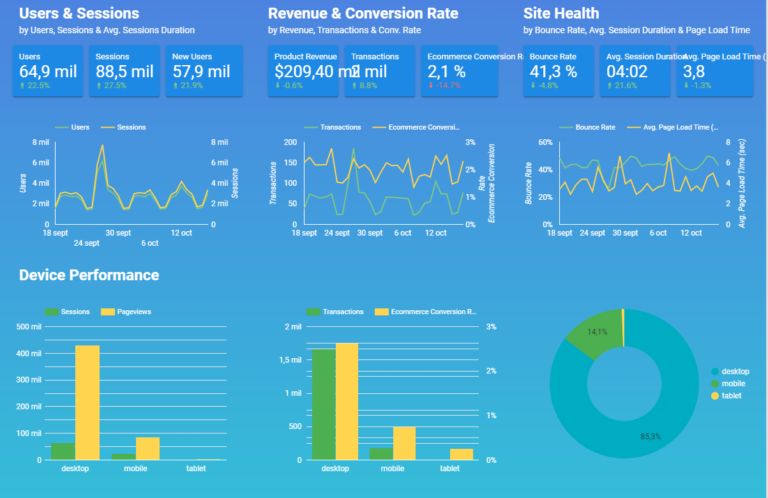
When choosing which dashboard to create, it is important to be aware of the types of dashboards.
The performance of a dashboard depends on a number of factors, avoiding “data vomit”, in those dashboards with a huge amount of data where you can’t see anything and it is difficult to know what is happening, let alone make decisions.
As we have discussed, the primary function of a dashboard is to be actionable. The dashboard transforms the way an effective business intelligence strategy is carried out into a data-driven environment.
Providing the right set of data to the right people within the organization is critical to the development of the business and its long-term success. Therefore, selecting the right type of scorecard is critical to producing lasting and cost-effective results.
There are different ways to divide or classify dashboards by typology.
For this article we have classified them according to the question to be answered. This is the most important as it will determine all the work of data creation, extraction and automation that we are going to do afterwards.
The end purpose for which you want to create the dashboard will determine the type of dashboard you need to make.
So the question you need to ask yourself is: What problems do you need to solve? The way you answer that question will determine the type of dashboard you use.
Accordingly, we differentiate between 3 types of dashboards:
- Operational. These dashboards allow you to see all your company’s data in one place.
- Strategic. Dashboard that includes the KPI metrics of the strategic business and/or marketing objectives.
- Analytical. These dashboards focus on helping to understand and identify users, business, market, trends, etc.

Metrics to include in an online marketing dashboard
The metrics to include in an online marketing dashboard are diverse, as almost always the metrics to include in the dashboard will depend on the objective of our dashboard and the nature of the business.
Whether we include some or others, we leave you with a series of fundamental metrics to include.
- Traffic by channel. Number of visits received in a period of time in the different marketing channels used.
- Temporal comparison of traffic by channels. Data displayed in graphical form to allow viewing the evolution and comparison of traffic acquisition over time.
- Best pages by channel. Which are the best pages that are giving us the best results in terms of business and traffic.
- New users VS recurring users. Knowing which are the most powerful channels for acquiring new users and which are the most powerful for building loyalty.
- Lead/channel. How many contacts achieved in a given period of time, how many possibilities of purchase or abandoned carts in a given period of time.
- Customers/channel. Customers acquired in each channel in the period under study. Being able to visualize the evolution of this metric over time in a visual way is an effective way of measuring the historical performance of each channel.
- Conversions/channels. Number of conversions or transactions carried out in each channel.
- Revenue. The main metric of any marketing strategy. Linked to the cost of customer acquisition.
- CAC (customer acquisition cost). Metric to know which is the best channel, the one that is giving the best and worst return on investment.
- ROI (return on investment). Metrics that together with the latter give us an overview of the performance of our online marketing campaigns.
Metrics to include in an SEO dashboard
The metrics to include in an SEO dashboard are not definitive, it will all depend on the timing of your reports or dashboards, the purpose for which you analyze the data and above all the person/s to whom it is addressed.
In general terms, we can summarize the metrics to be taken into account in your SEO dashboards as follows:
- Organic traffic. Fundamental metric to measure the performance of the actions in your SEO channel in a given period of time (weekly, monthly, quarterly, etc).
- Temporal comparison of organic traffic. Organic traffic is a metric that by itself does not tell us anything. Making a comparative analysis with other periods (for example with the same period of the previous year) is a MUST in your SEO analysis and reports.
- Impressions. KPI to measure the “visibility” and the market that we are capturing in the SEO channel in a given period. Please note that in many cases it is a predictive metric of what may happen in the coming months.
- CTR (Click Through Rate), are your goals working, a r e your titles and meta descriptions working, are you appearing in the featured snippets, are you appearing in the featured snippets? This metric should help you with all these questions.
- Conversions. Fundamental metric to measure the performance of SEO actions and main objective whatever their nature.
- Income. It will depend on the business model of the project. For example, an ecommerce or a website monetized with ads is more feasible to measure revenue than a service website.
- Keyword ranking. Words positioned in the top 3, top 5, top 10, top 20, top 30. Not only the quantity, but the quality, do they bring qualified traffic?Are they related to business objectives?
- New and lost backlinks – am I doing link strategies? What links have I generated and what links have I lost?
- Anchor text. Anchor text used in the link building strategy and their percentages.
These metrics at a general level would be the most relevant to follow, obviously, there are many metrics left out that we could surely include, but remember, a dashboard should be clear and concise, it should not be a data fair where we waste our time, it should make it easier for us to draw conclusions at a macro level.
Other performance related metrics such as load speed or content such as average time on page or bounce rate, can be metrics collected in a micro dashboard internally, or in a more general one depending on the business objectives.
In Conclusion
In conclusion, a dashboard is a visualization of important information for the business, its main purpose should be to monitor the performance of the company or department.
A good scorecard should show the key performance indicators (KPIs) that will allow you to identify and visualize where the company stands, what challenges, opportunities and future difficulties it faces.
In this way, it should enable you to make decisions accordingly to achieve your business objectives.
If you’ve made it this far, we should be able to help you decide which dashboard is right for you, as well as give you a starting point if you want to make your own.
At Isocialweb we create dashboards for all our online marketing services, from CRO, through SEO, SEM or Content.
We hope that with these tips you can start creating your own dashboards. If you have any questions or need to improve your dashboards and business performance metrics please do not hesitate to contact us.
Frequently asked questions
What are dashboards?
Dashboards are used by companies and their departments to monitor the most important metrics of the business or department. To learn about the different types and metrics to include in a dashboard do not miss this article.
What is an Excel dashboard?
An Excel dashboard is a way to visualise key business performance data and metrics using the excel windows tool.
What is the purpose of a control board?
The objective of a dashboard is to visualise in a graphic and easy way the most important and key information of a company or department. Depending on the objective and the target audience, there are different types of dashboards with different metrics to be displayed.
What makes a good dashboard?
A good dashboard should be able to meet these requirements:
- Simplicity
- Clarity
- visual
- Updated
Links and recommended reading
- https://www.techtarget.com/searchbusinessanalytics/tip/7-benefits-of-BI-dashboards-for-businesses
- https://en.wikipedia.org/wiki/Dashboard_(business)
- https://www.datapine.com/blog/strategic-operational-analytical-tactical-dashboards/#dashboard-types
- https://www.klipfolio.com/blog/starter-guide-to-dashboards
